As we all know, there are many log files inside Tableau Server and Tableau Desktop. Sometimes we need to look through it to find the possible root cause of our problems. But there are too many log files to look at and our brain is not trained to look at log files. Tableau internal team has developed an internal tool to analyze these log files easily and by using Tableau itself to make it visually appealing and easy to find possible root causes.
And now Tableau just released that internal log analysis tool as an open source “self service” log analysis tool called LogShark. You can read the announcement here.
I play around with LogShark and want to share a lot of screenshots with everyone. Enjoy.
Install
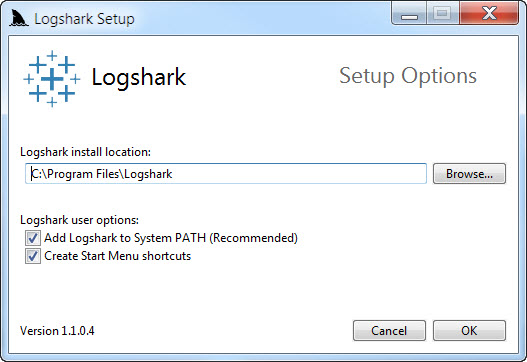
Read the pre-requisites and detailed install guide here. Then just double click and choose the default options. You can also change the folder options as below then click OK.
Set PostgreSQL database information inside Logshark.config

Download log files from Tableau Server using tabadmin or from Status tab

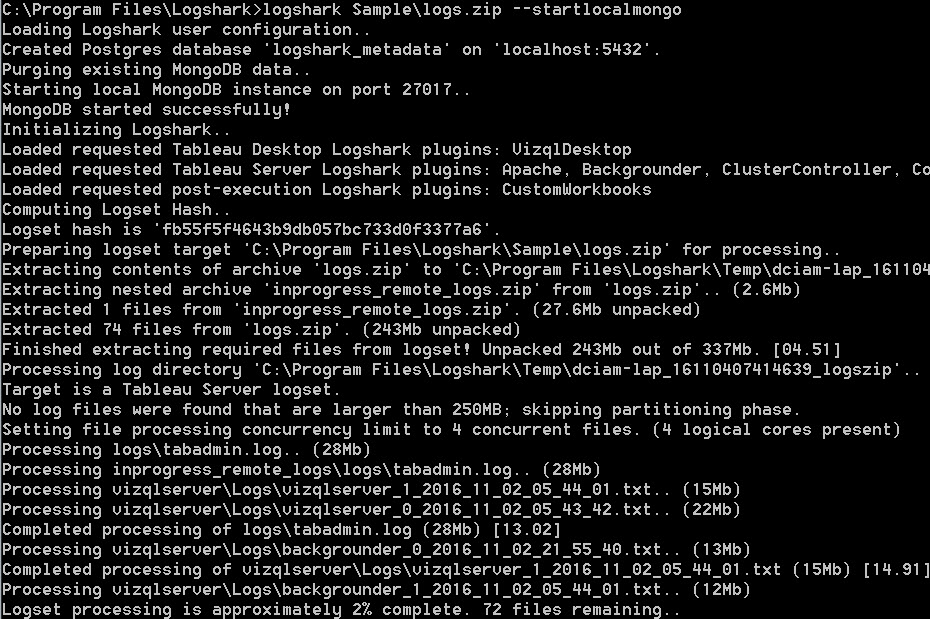
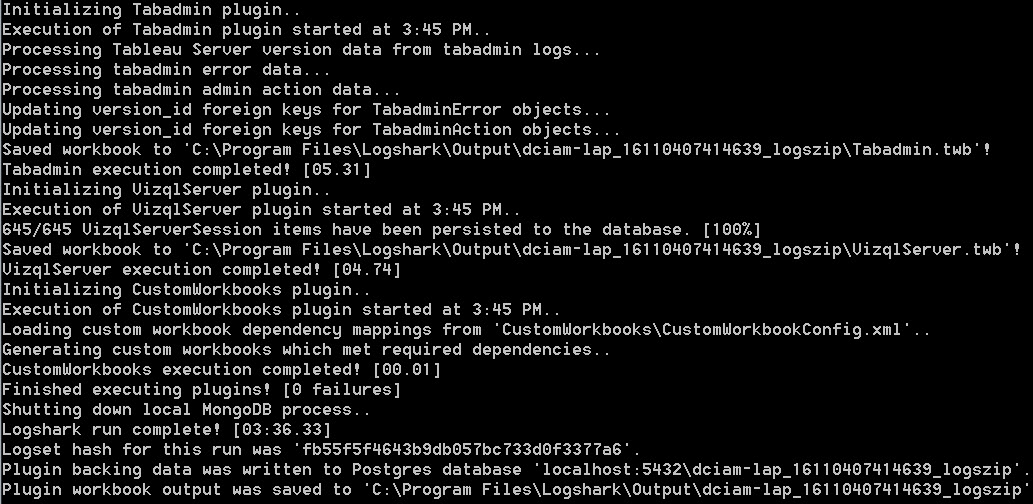
Open cmd.exe as Administrator and run Logshark
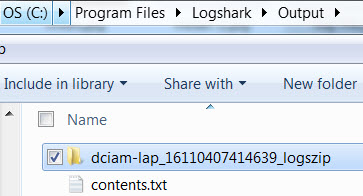
Open LogShark Output folder
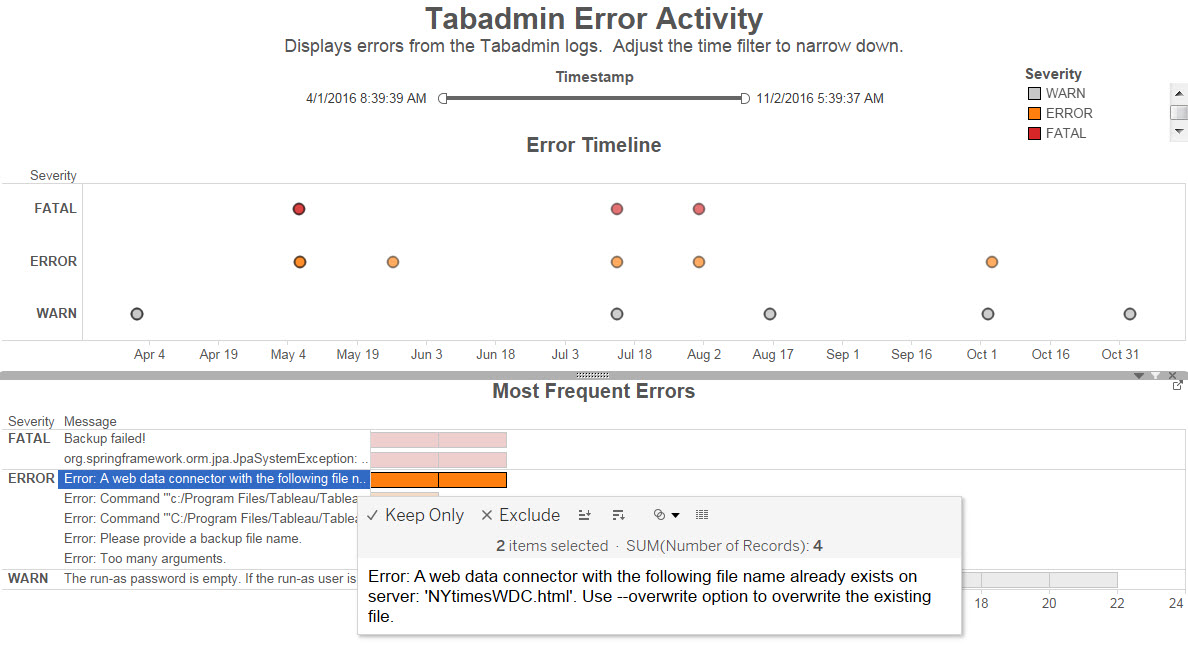
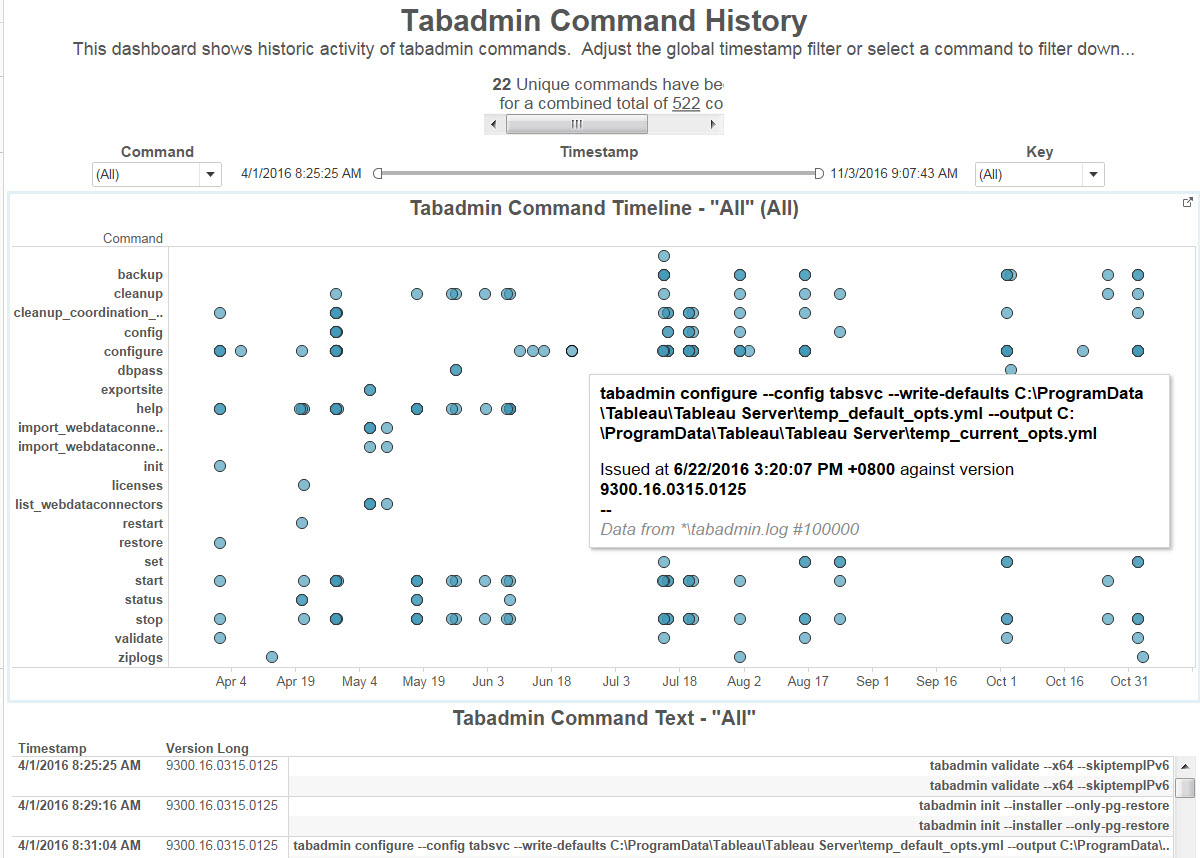
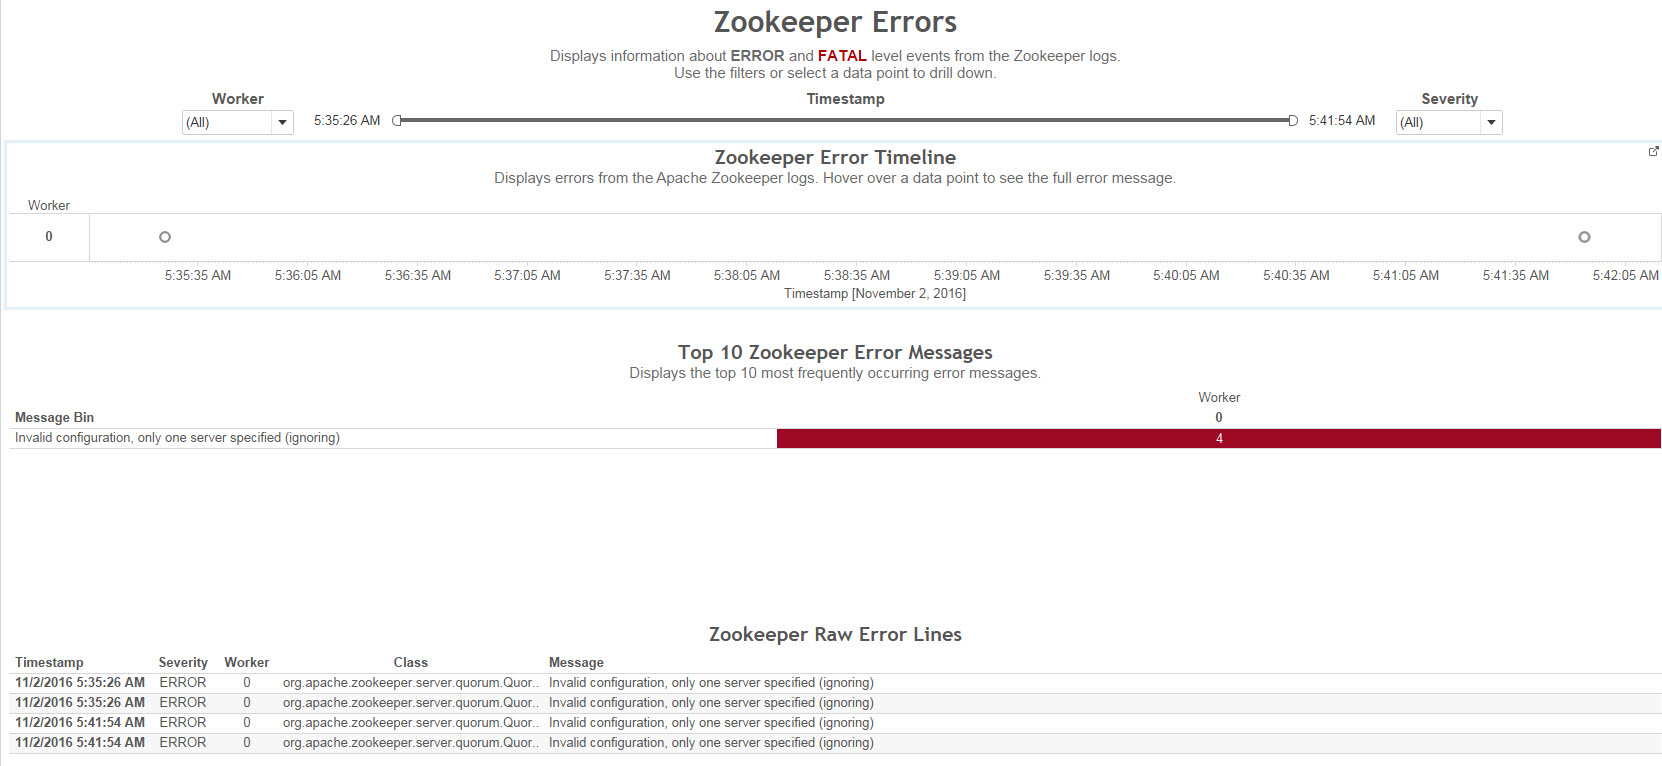
Open the generated workbooks

Enjoy the vizzes


Go ahead, install and find the possible root causes of your problem. And don’t forget that this tool is not officially supported by Tableau. It is open source so let’s contribute codes and make it even better.
Enjoy today 🙂

Great stuff on LogShark!
LikeLike