In many cases we want to remove some records from our viz and filter is the first thing that we should use.
Filter looks simple, just click and drag the dimension/measure to it. But Tableau is very smart, it looks simple but actually very powerful tool. You should know various filter behaviors to choose the correct one.
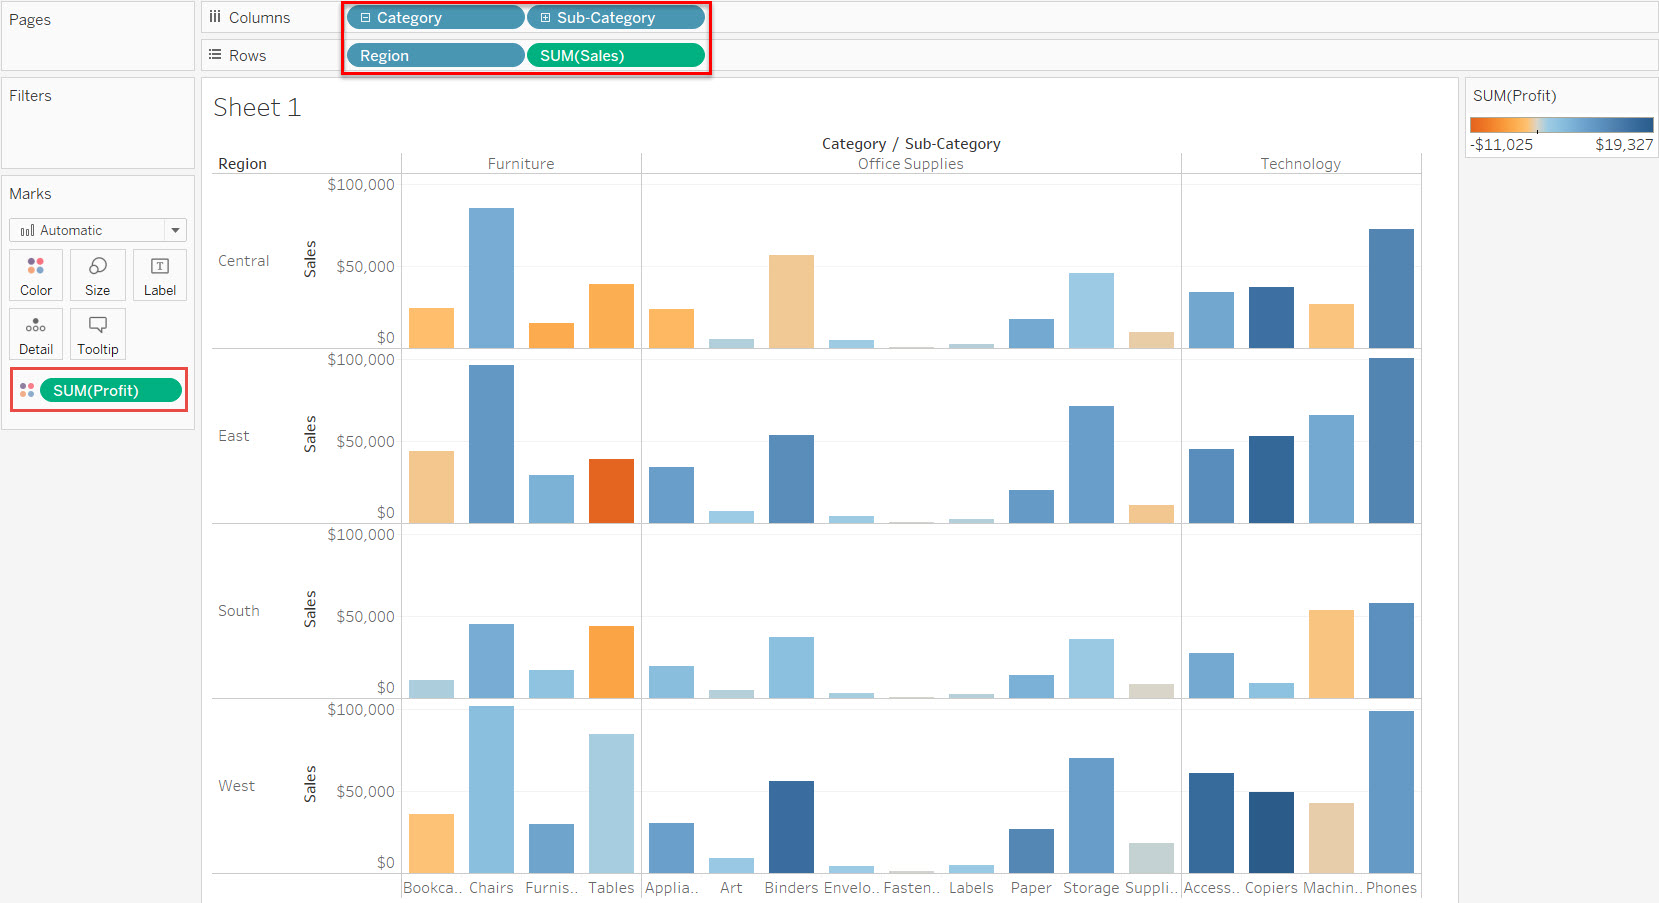
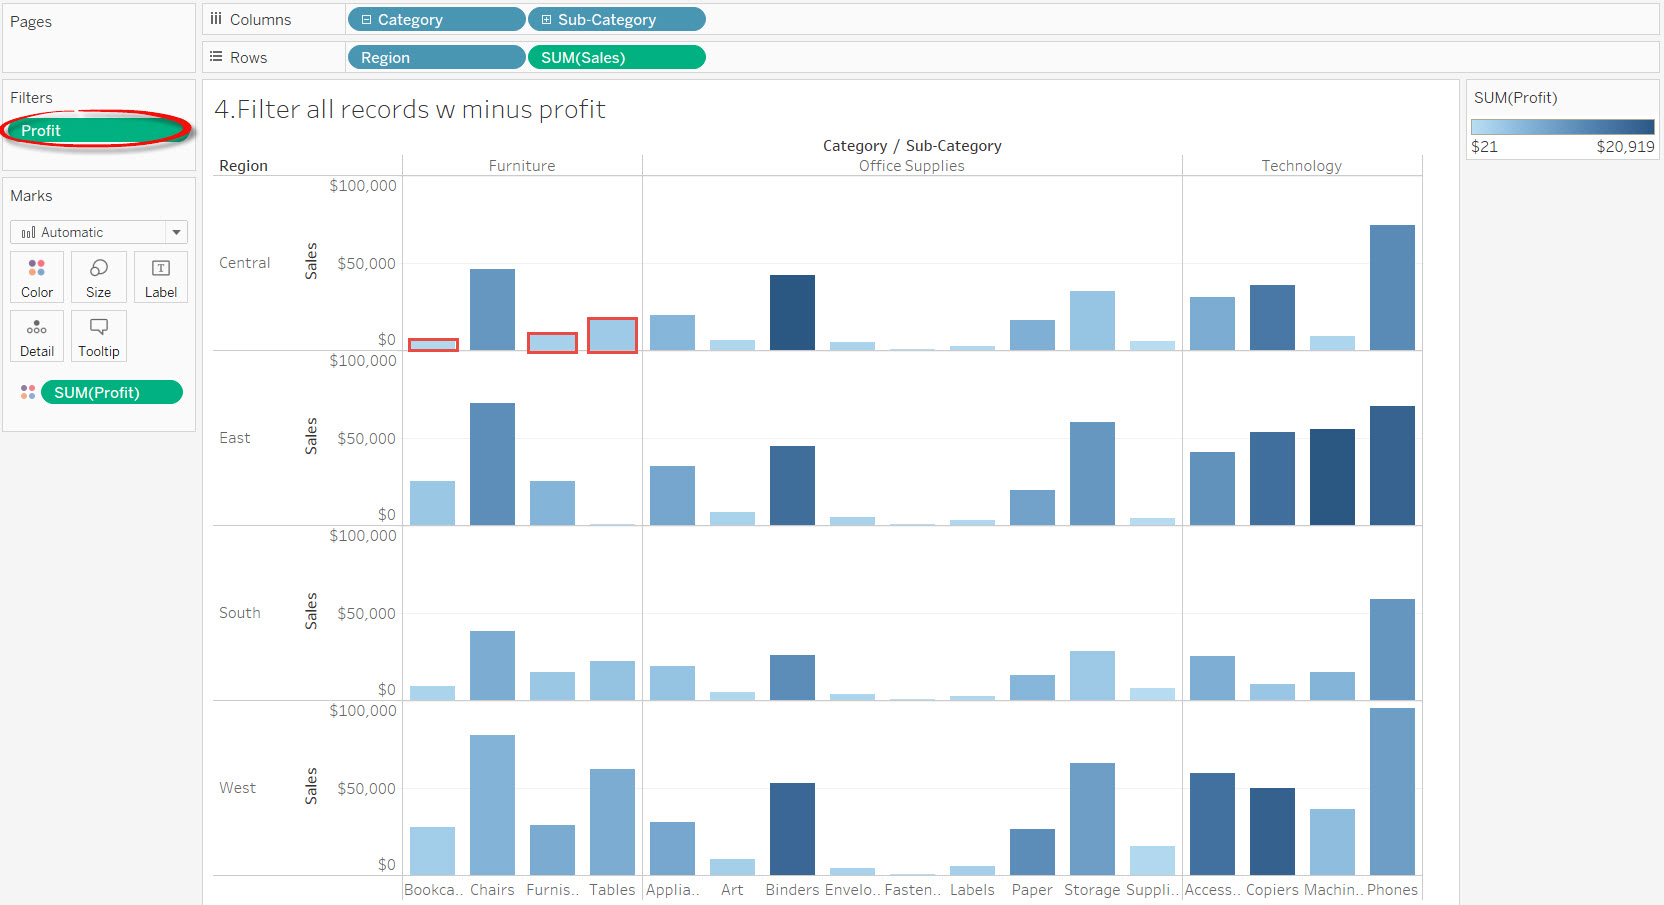
Scenario: i have below viz and it include all sales records with positive profit and also minus profit. I want to remove all the records with minus profit. I only want to see the viz contain sales record with positive profit.
To create the viz, let’s use tableau desktop superstore sample data source:
Then build the viz like the above by:
- Put Category, Sub-Category to Columns
- Put Region, Sales to Rows
- Put Profit to Color Mark
Now i want to remove all the records with minus profit from the viz by using Filter but first i will show you the WRONG way so you will know the difference.
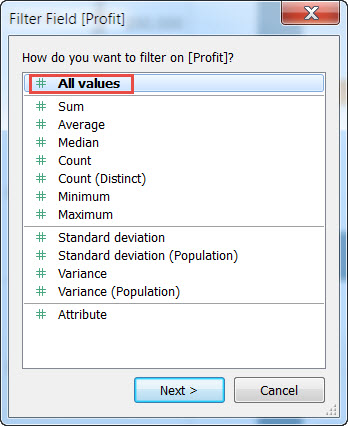
I click Profit in the Measures area and drag and drop it into Filters area and Tableau will show below option:
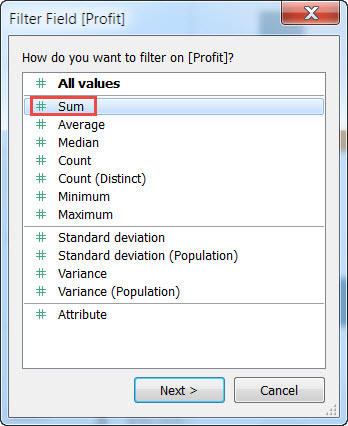
Wrong way: choose “Sum” and click Next.
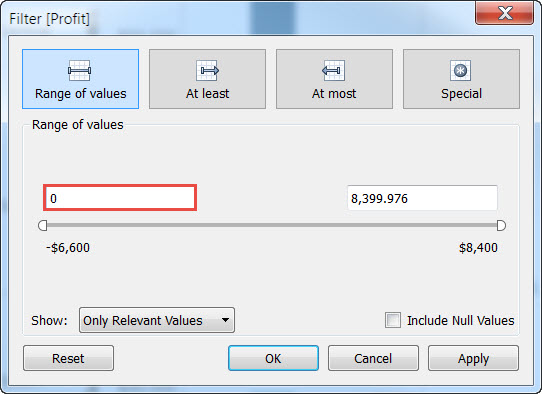
Then change the first range of values to 0 (zero):

Clik Ok and you will get below viz:
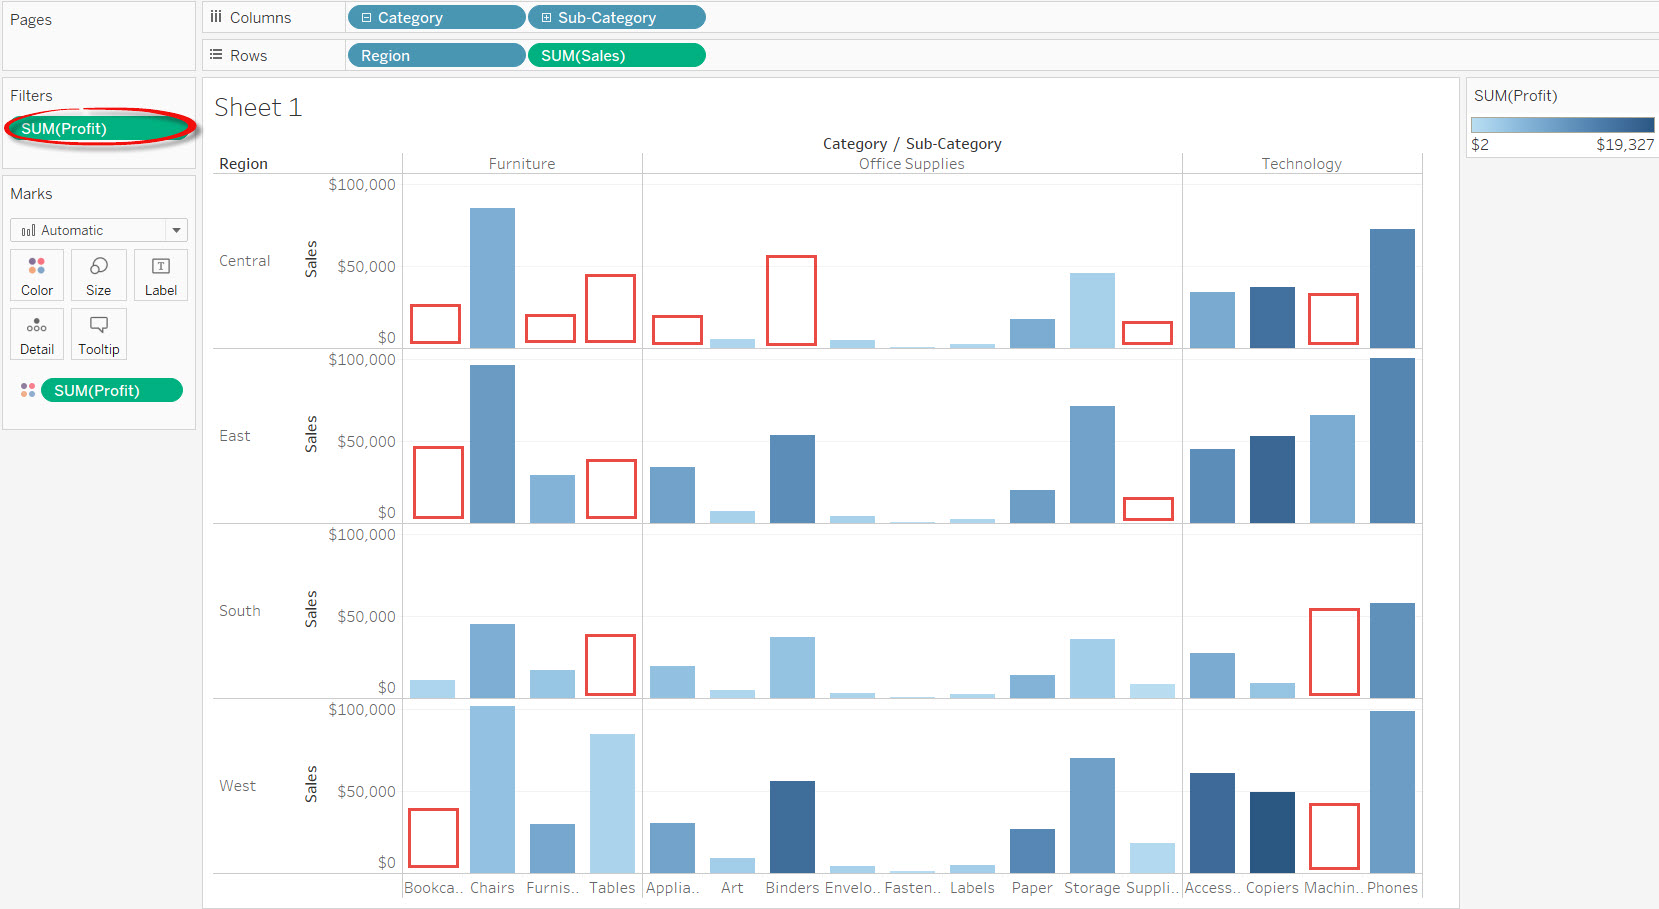
You can see that there are a lot of places/panes without a Bar chart. In the above picture i use empty red rectangle to show those places/panes without Bar chart. And inside the Filters area you can see green “Sum(Profit)” pill.
What happen ?
There is nothing wrong with Tableau, we chose the wrong option. In the above wrong scenario we made mistake by choosing Sum as the aggregation when you click and drag profit to Filters area.
This is what Tableau will do when you choose Sum as the aggregation:
- aggregate the records with Sum of Profit
- filter it by removing all Bar chart with Sum of Profit with minus value
- keep all records with positive Sum of Profit value
- show all the bar chart with positive Sum of Profit value
The result is wrong because we just want to remove all the records with minus profit. We don’t want to Sum all of them then remove the final Sum with minus profit. We want to remove the records themselves from the viz. Not the aggregated Sum of records.
Solution: don’t choose “Sum” in the filter field.
Choose “All values” when you click and drag Profit into Filters area:
And change the first range of values to 0 (zero) and click OK:
You will see the Correct viz below:
Every panes have Bar chart. I highlighted 3 places that don’t have Bar chart in the wrong viz with red rectangle and now they have the Bar charts. And inside the Filters area you can see a green “Profit” pill.
This is the correct method if you want to see the viz without minus profit records.
When you choose “All values”, Tableau will:
- look at all the values/records (tableau will look at the lowest level of detail which is looking at the records themselves, there is no aggregation at the lowest level of detail, aggregation is needed when you want to see at higher level of detail)
- filter all values / records by removing all records with minus profit
- keep all records with positive profit
- show the viz and aggregate it accordingly (in this viz we choose to Sum by Profit and Sum by Sales)
- the viz will show bar chart without records with minus profit
There is an “Undo” button in Tableau so keep playing with your data and undo all the way when things go wrong.
Enjoy Today !
